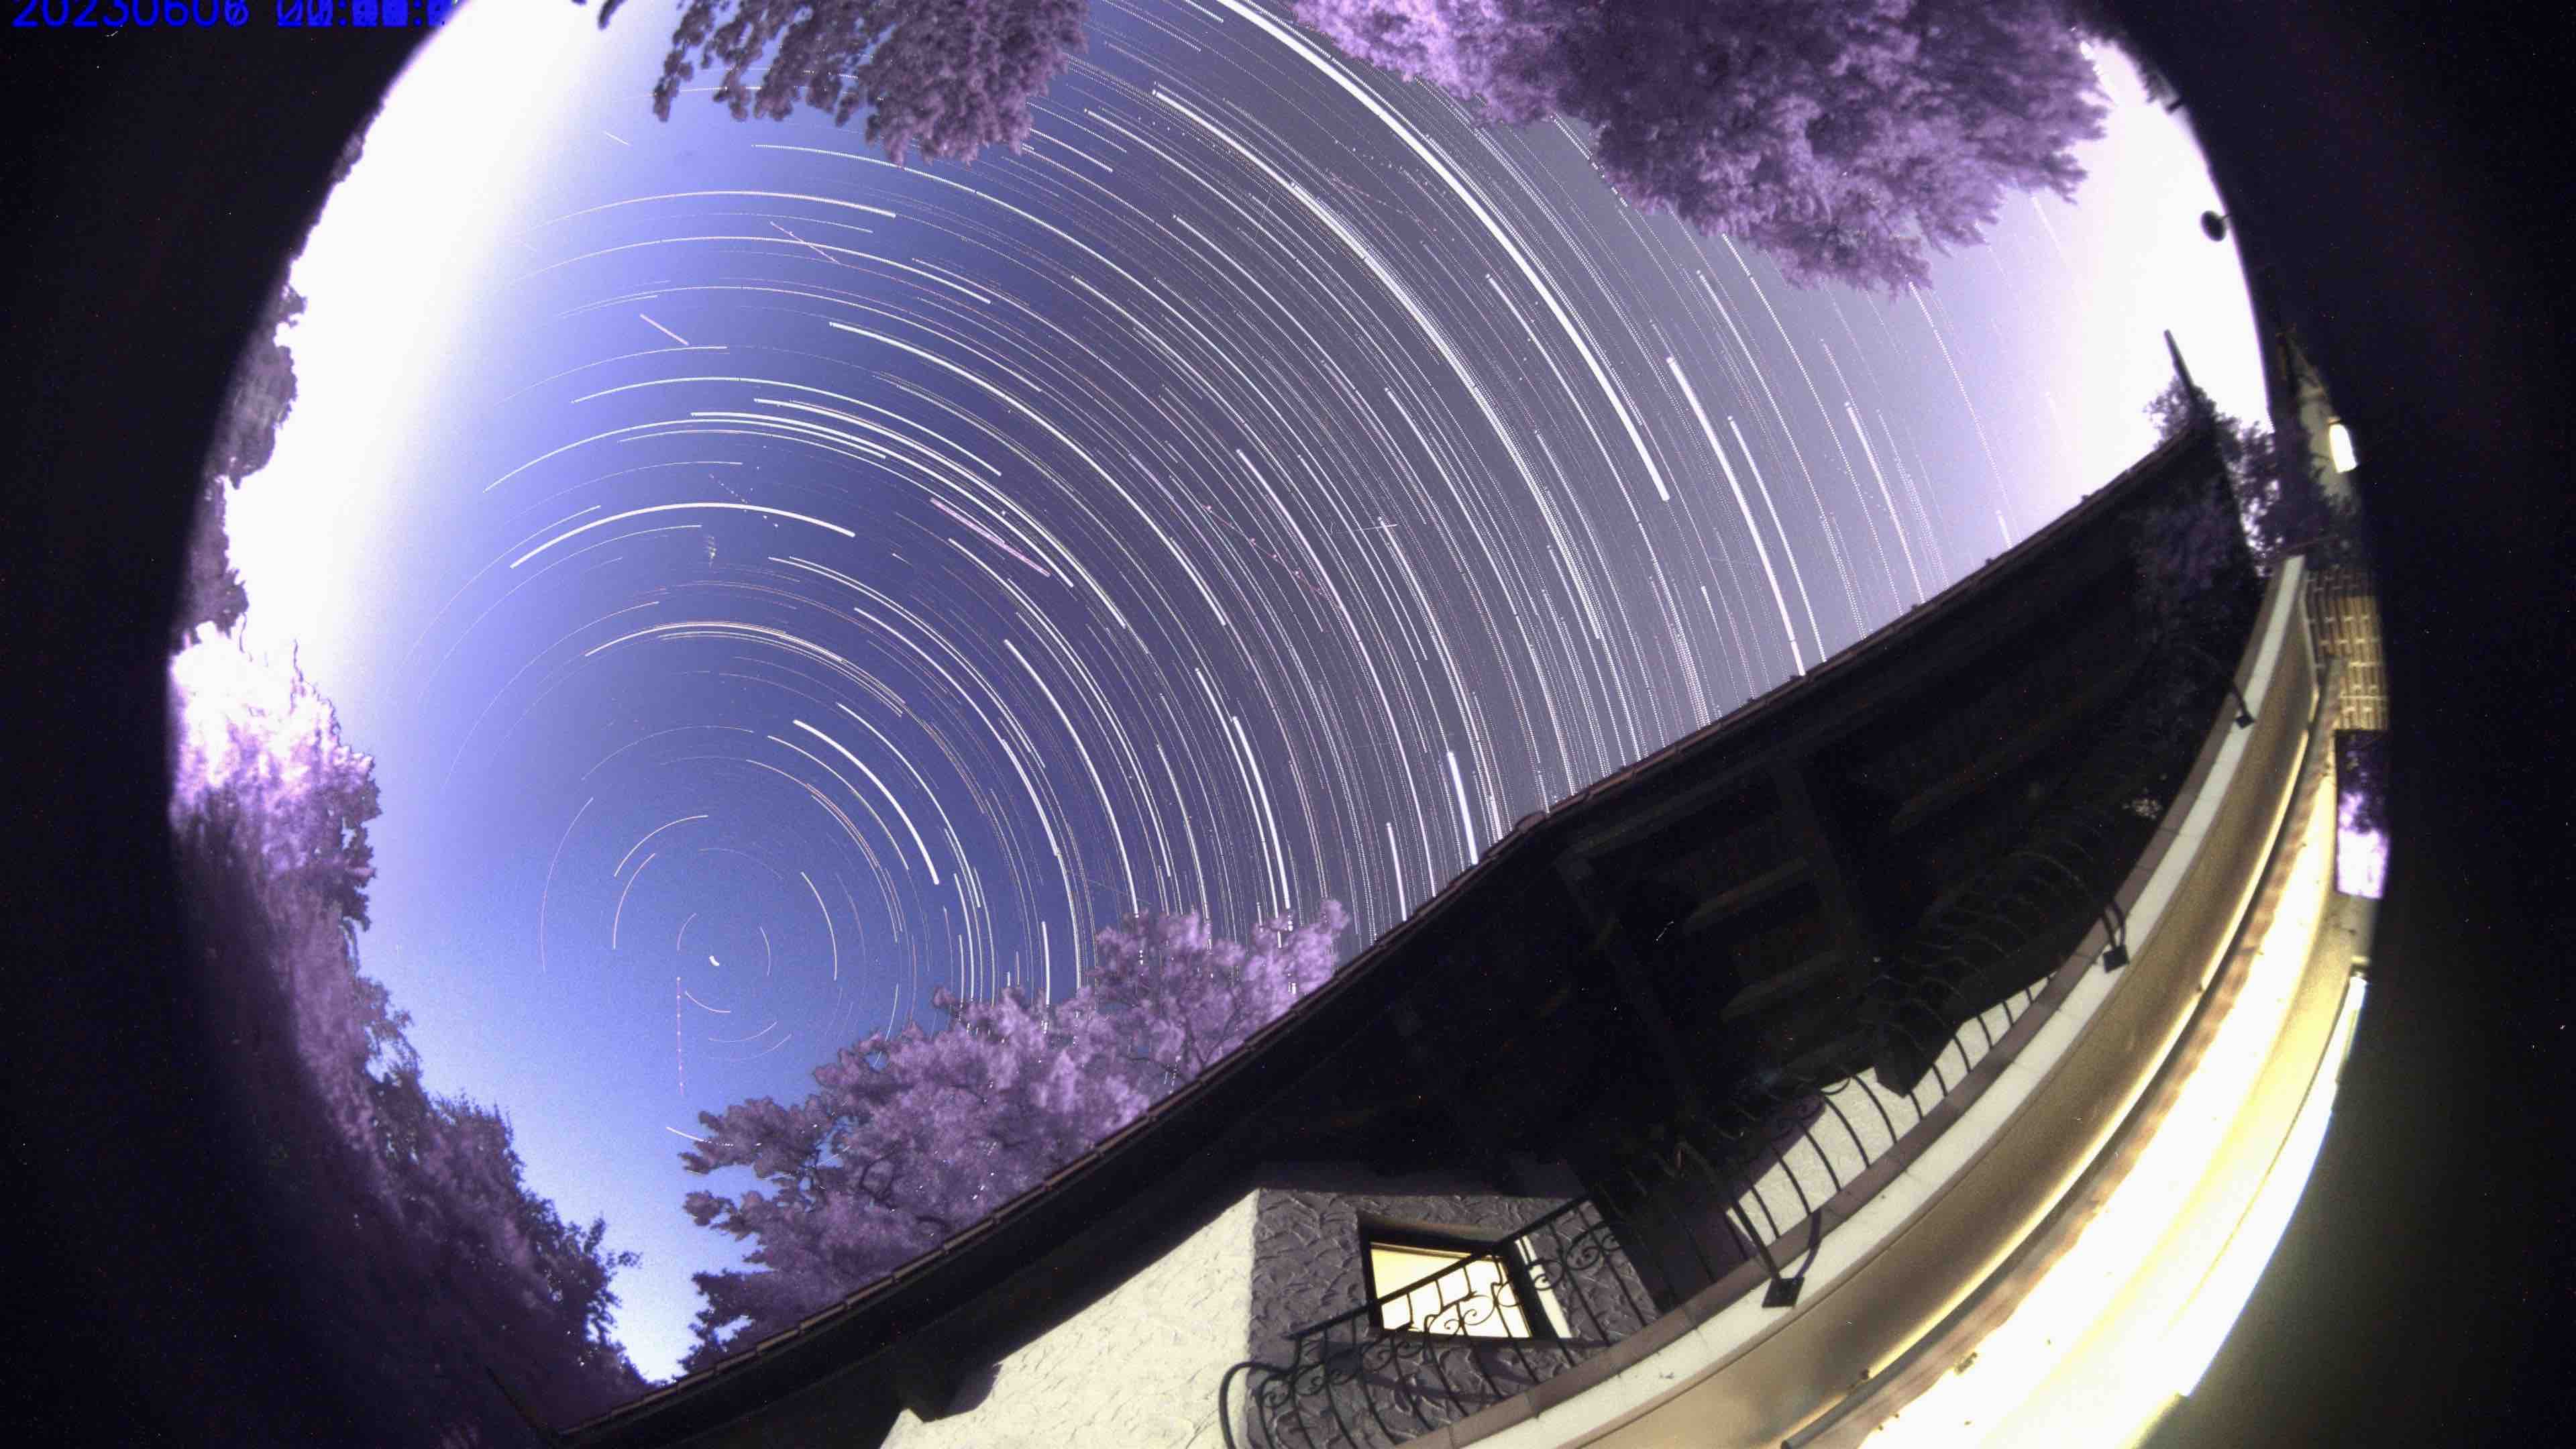
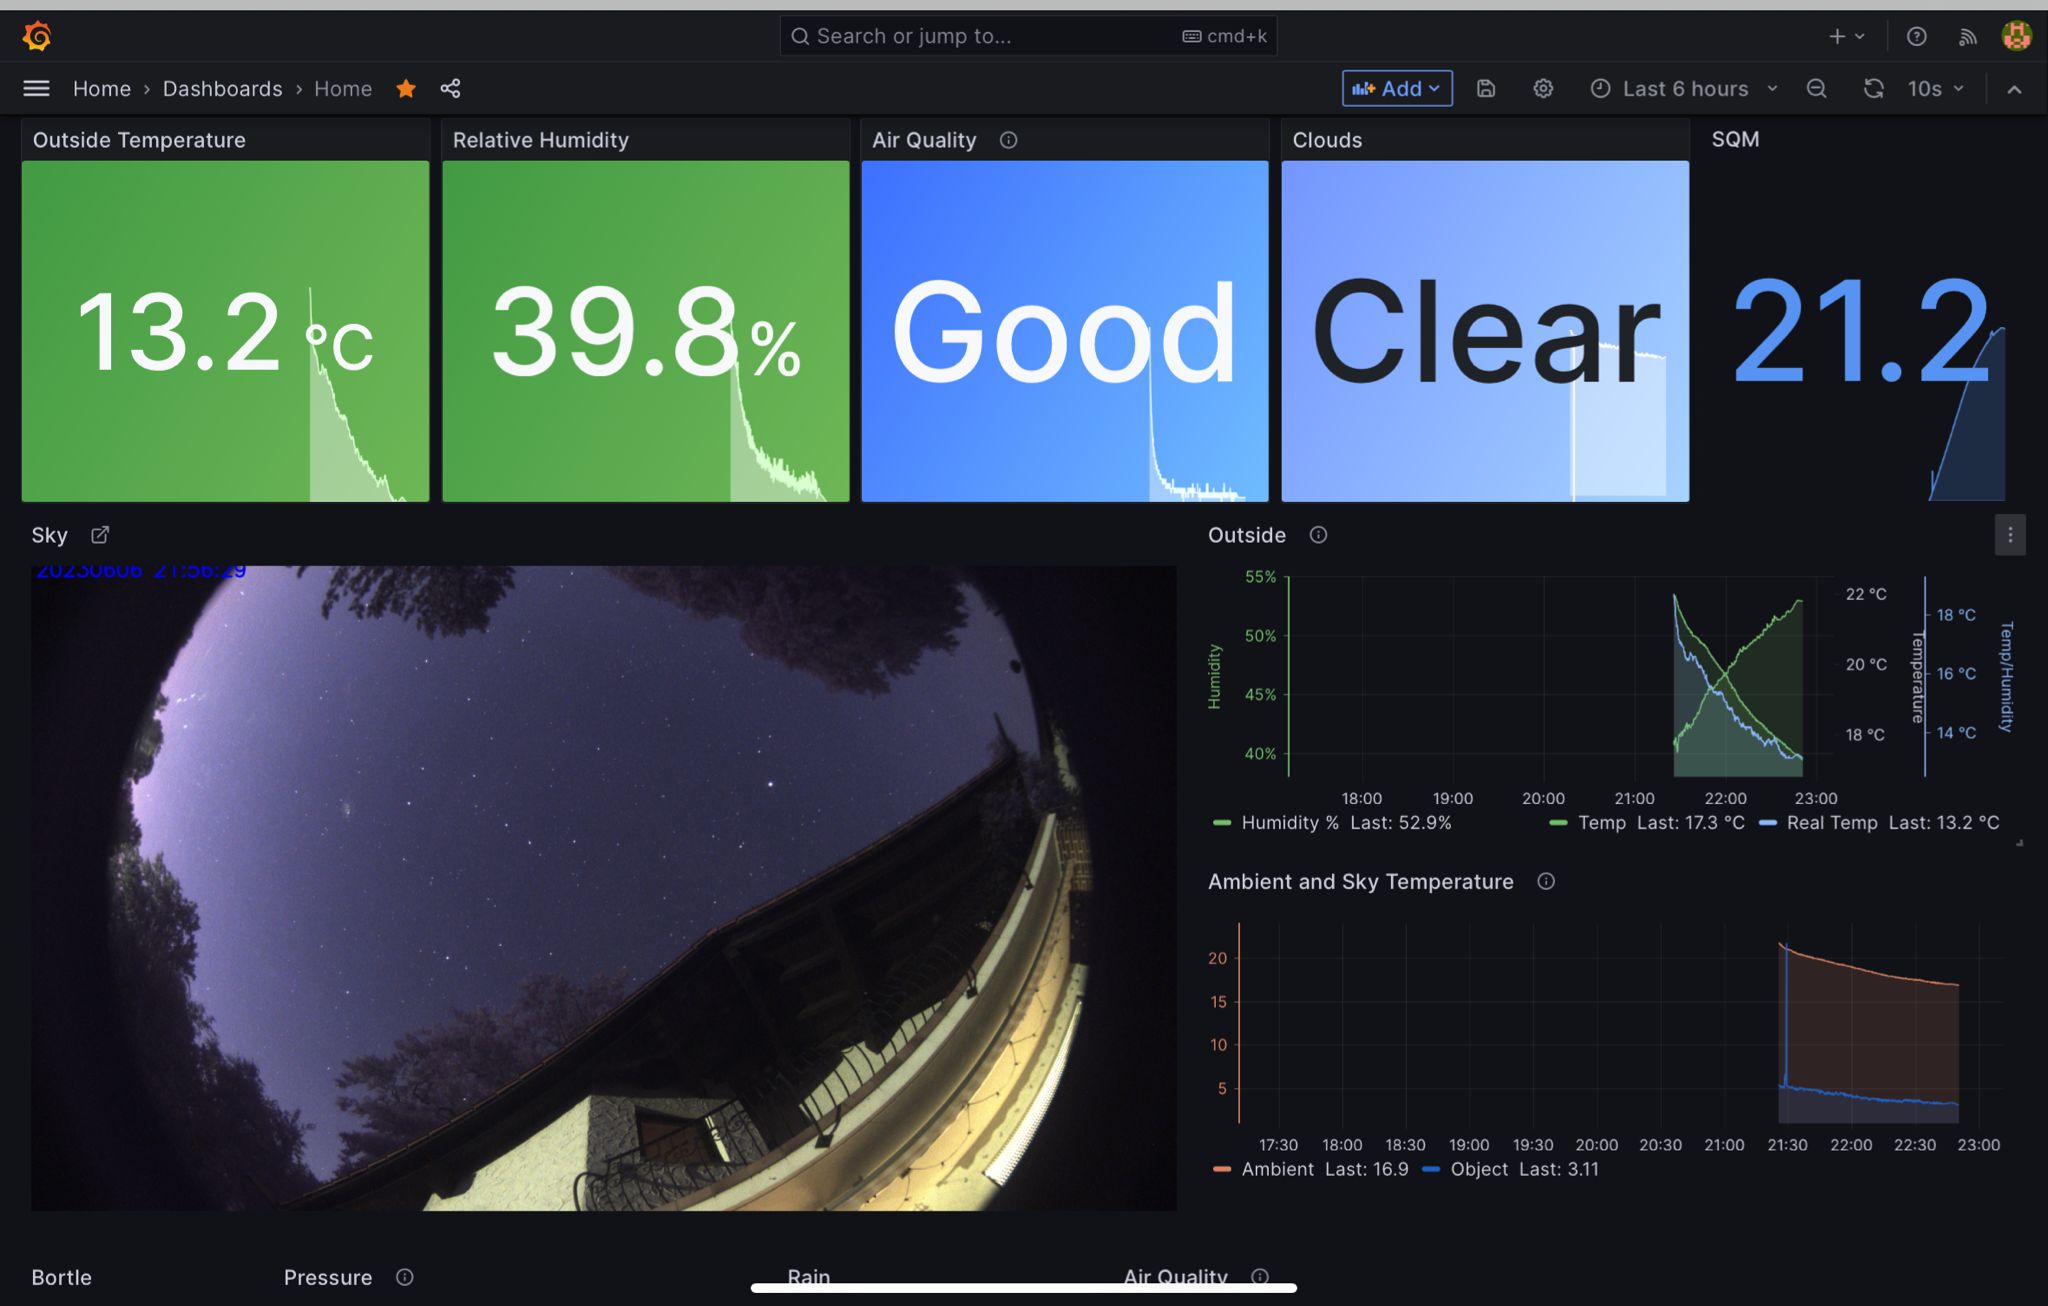
Wow!
I can’t believe this is actually finally happening!
This is from the very first night

As described in the previous posts, our system is saving all the sensors data in InfluxDB.
This data is then being used by Grafana dashboard to show us insights based on historical data.
I’ve uploaded to the Git repository the Grafana.json file which contains the first dashboard and you can start from there.
